
MaxYield-ECG.
One Engine.
Every Heartbeat.
MaxYield reads the ECG the way a trained technologist does - the whole waveform, beat-by-beat - and hands the result to the software you already run.
Built to be integrated. Not a platform to replace yours.
We do not remove the noise. We read through it.
MaxYield does not modify the ECG. It does not filter, subtract, reconstruct, or interpolate. It analyzes the raw recording as captured and returns measurements against that signal.
That is a design decision, and it came from failure. The founding team of signal processing experts, leveraging the supercomputer at the University of Alberta, set out to build better de-noising for wearable ECG. They succeeded - and discovered their own de-noising was cancelling real cardiac signal alongside the artifact.
Every filtering step is a step where physiology can be removed with the noise. So the architecture changed. Instead of removing noise before measuring, MaxYield learns the waveform well enough to locate its boundaries within a noisy trace, and measures against what was actually recorded.
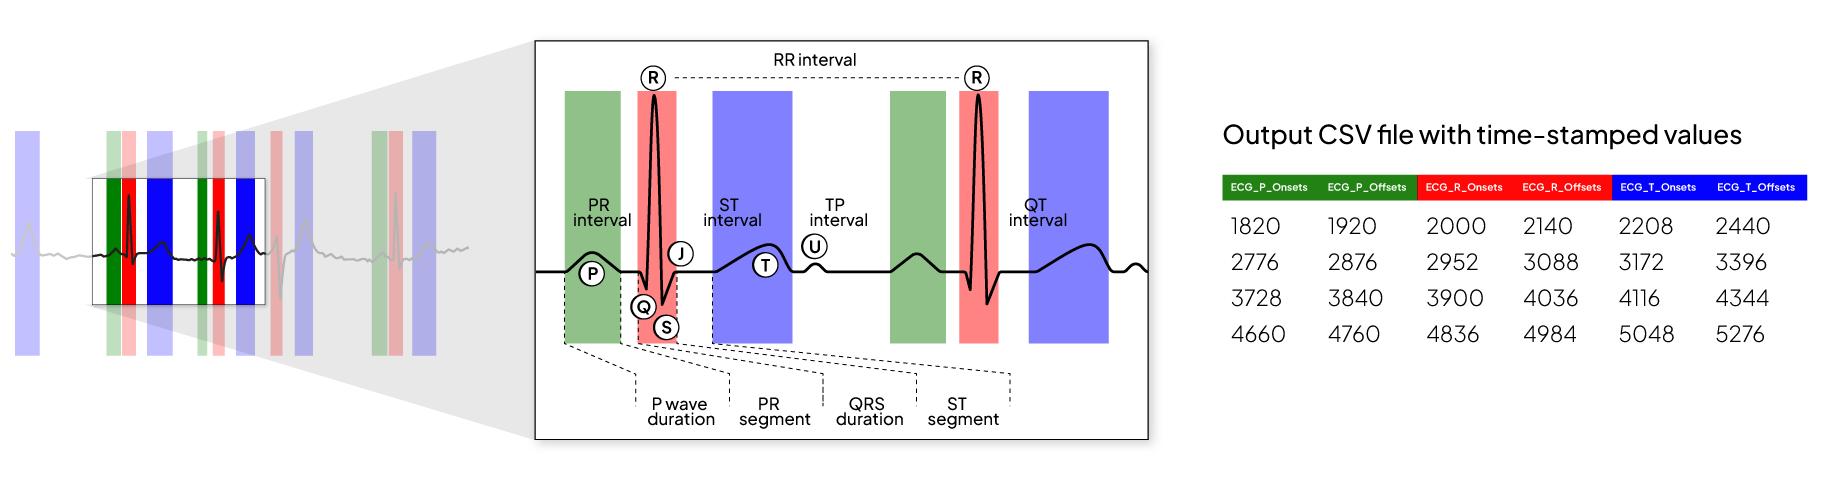
What we resolve, and what we derive
For every beat MaxYield locates six boundaries: the onset and offset of the P-wave, the QRS complex, and the T-wave.
Automatically calculated intervals are output alongside the boundaries they derive from - PR, QRS duration, QT, and RR, heart rate, etc.
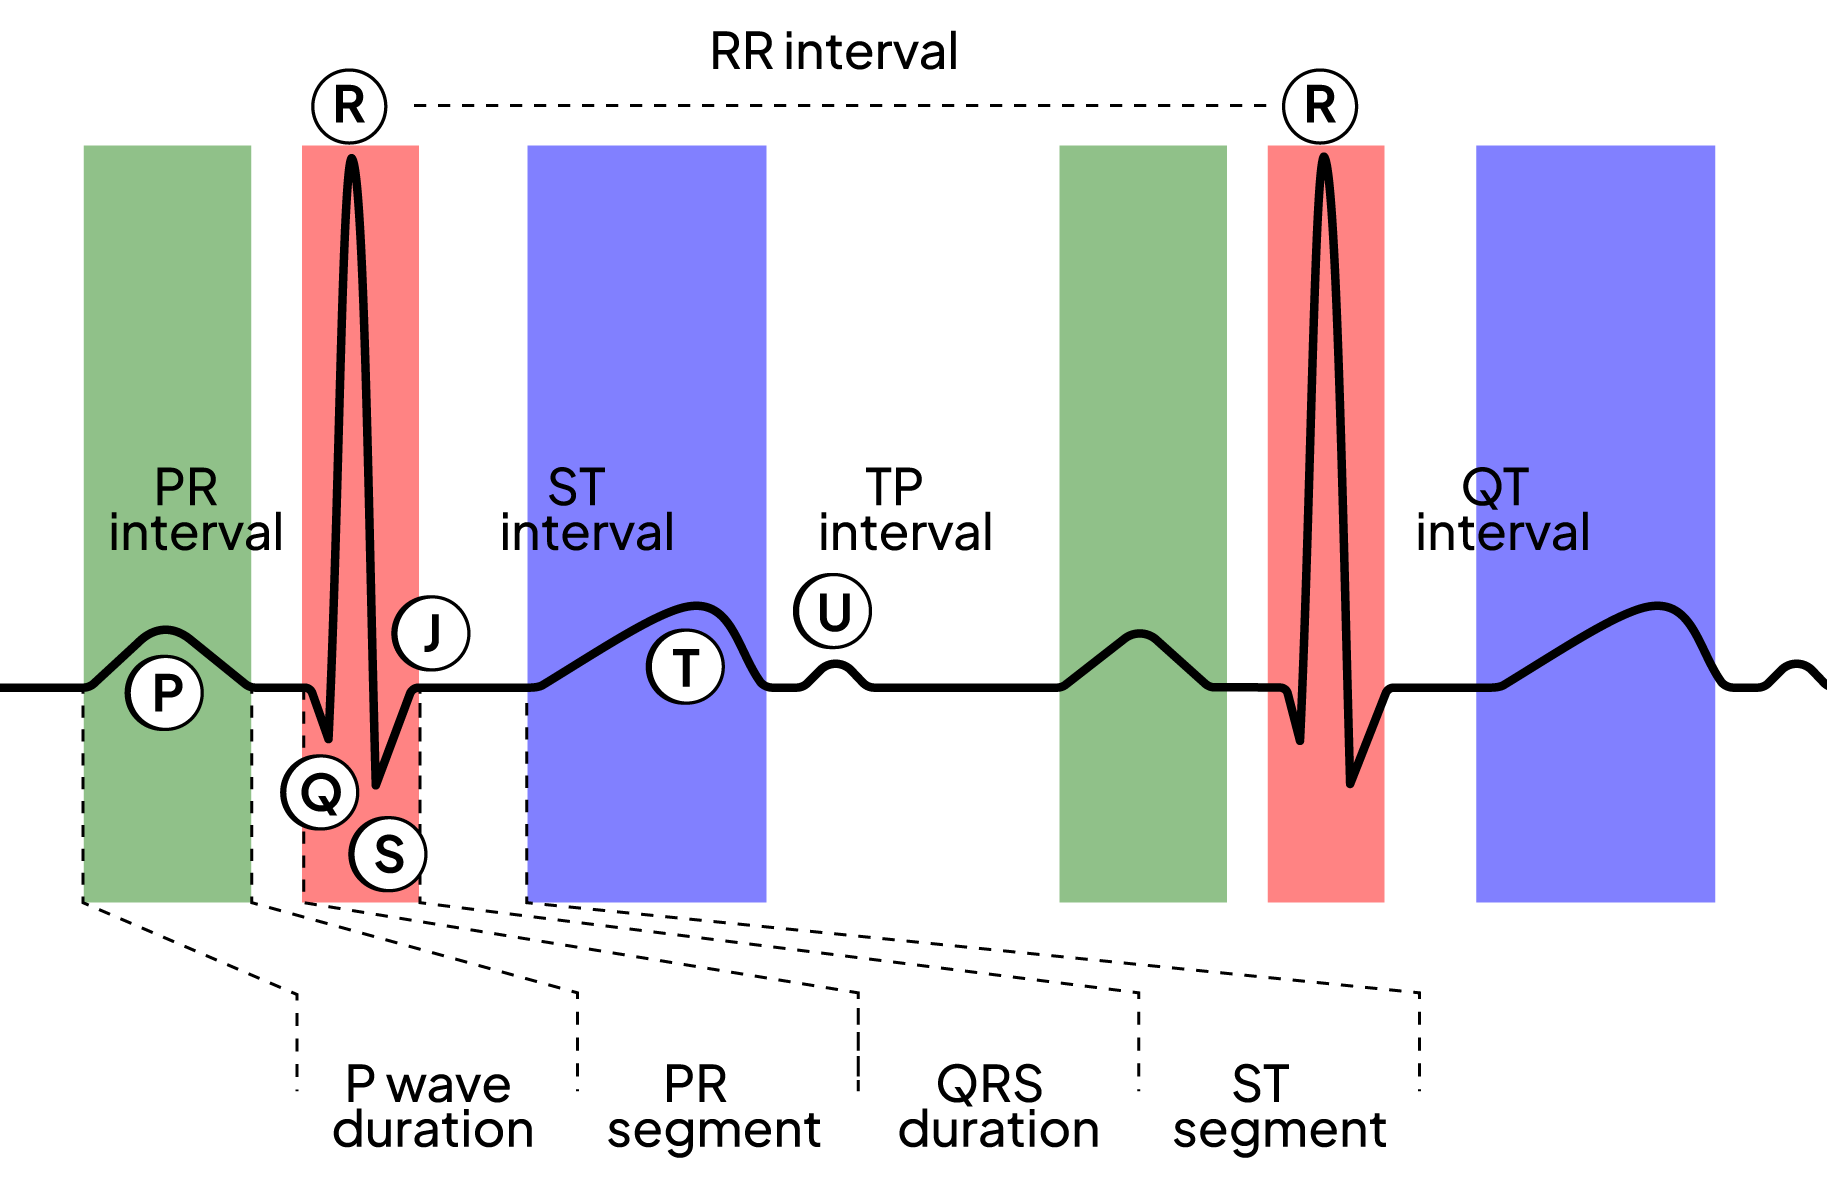
The P-wave is the hardest wave in the ECG for algorithms and for people. It is low-amplitude, easily buried in artifact, and the boundary that expert readers most often disagree on. MaxYield reports P-wave onset and offset per beat, and reports non-detection as a distinct state rather than as a silent gap.
The acceptance threshold this was measured against was not chosen by us - it was derived from the level of agreement expert readers reach with one another on the same data, reviewed with our Medical Advisory Board.
What comes back
P-wave annotations - onset, offset, duration. Reported where detected. PR, QT, RR, Heart Rate and other time-series intervals in milliseconds. Signal Quality Score, from 0 to 100%.
AFib, bradycardia, and tachycardia events with first and last beat index and millisecond start and end times. Average heart rate reported across bradycardia and tachycardia episodes.
AFib burden, as a proportion of both time and beats. Reported as a proportion from 0.0 to 1.0, not a percentage. Artifact regions, per lead, with time windows.
A quality score on every beat
MaxYield computes a signal quality score per lead, continuously across the recording, and reports it alongside every beat it returns.
Minimal noise. The device’s most reliable output range.
Noise present. Full beat-level output is still computed and reported - annotations, intervals, rhythm classification - flagged for added scrutiny.
Beats excluded from output. The underlying ECG signal is retained and available for review.
Artifact regions are reported per lead with their time window, so a reviewer can navigate directly to any segment the algorithm found degraded.
A high score means the signal in that segment was strong. A low score means it was not. The score is computed from the same recording the measurements come from, so it describes the exact material the output was derived from.
That relationship holds by design, not by assumption - it’s what makes the score worth reporting rather than just computing.
Our scoring and our thresholds are documented. You can see where the boundaries are, why a segment was flagged, and what happens at each level.
Because the score travels with the data, your product decides what to surface, what to hold for review, and what to suppress.
Built with the people who read these recordings for a living
Our Medical Advisory Board is not an endorsement panel. Key Opinion Leaders in cardiology and electrophysiology work directly on the product - hand-labelling training data, advising the roadmap, and guiding the logic behind features targeted for future clearance.
Get more from the data you already have
MaxYield doesn’t necessarily help your team produce more reports faster - it helps you get more out of the data and research projects. Reprocessing existing ECG recordings with per-beat structure can surface signal a peak-triggered pipeline never captured the first time. We aim to de-risk the cardio research being done in the non-clinical space.
Built to be integrated, not a platform to replace yours.
MaxYield does not compete with the analysis you’ve already built - it goes underneath it. Your algorithm starts from R-wave-triggered data; MaxYield quantifies every P-wave, QRS, and T-wave, alongside every interval. You’re not replacing what you built. You’re raising its floor.
Put MaxYield underneath
what you already run.
Your algorithm starts from R-wave triggered data. MaxYield gives it resolved QRS boundaries, P-wave delineation where detected, per-beat intervals, and a quality score alongside every measurement it returns. You are not replacing what you built. You are raising its floor.